


Key takeaways
- Consider using publicly available information about weather, fire likelihood, and the Rural Urban Interface to understand which of your homes might be located in areas at heightened risk of wildfire.
- Consider combining this information with other data about your homes, and who lives in them, to create an organisation-specific, holistic picture of wildfire risk across the homes you own and manage.
- Consider how to identify and support residents that might be unable to take action to prevent and mitigate wildfires, or evacuate themselves if one occurs.
- Consider using this information to develop a dynamic, matrix approach to wildfire risk, one that is regularly updated and can inform your strategic asset management and maintenance planning.
Housing providers should consider taking a data-driven approach to understanding and responding to the risk posed by extreme weather, including wildfires.
As with other climate risks, wildfires can affect any home in any community. However, there are some ways you can identify homes, residents, and communities that might be at more risk from wildfire than others. You can consider using available data – both that you hold, and that is available in the public domain – to inform a holistic, organisation-wide assessment of risk. This means you can then make decisions about how, when, and where to prioritise your resources.
Tools to understand the geographical risk of wildfires
Wildfire is a geographical and seasonal phenomenon. In risk terms, a major wildfire spreading into residential areas is generally classified as a low probability, high impact event.
There is some evidence that there is a broad geographical pattern in the UK to future wildfire risk. The Third Climate Change Risk Assessment (CCRA3) Technical Report found that “the risk of wildfire in the future is likely to increase in the UK, with about half of the increase due to rising temperatures and most of the rest to reductions in relative humidity. […] This means that south, east and central regions of England are most likely to be affected, especially in summer, with little change in western Scotland and Northern Ireland, but this partly depends on the scenario and the fire indicator.”
In addition to these broad patterns, you can use public data and information to build a picture of which of your homes might be at greater risk.
Met Office
Consider developing a process for monitoring the weather, especially during the summer months. This can be as simple as designating a lead within your organisation who is responsible for monitoring temperatures in key locations that might be more at risk from wildfire, and/or monitoring for yellow, amber, and red alerts issued by the Met Office. Any heatwave or sustained period of high temperature can cause increased wildfire risks.
FireInSite
FireInSite is a fire prediction tool that forecasts the probability of a wildfire starting, how quickly it will spread, and its intensity. It does this for a location that can be selected by the user. It is a freely accessible web-based application, and although it is aimed at fire and rescue services and land managers, it can also be used by housing providers to understand the scale and spread of fires near to your homes.
The Rural Urban Interface (RUI)
You can consider taking steps to identify which of your homes are located on the Rural Urban Interface (RUI). Homes that are located (or built) next to rural areas that are more prone to wildfire risk (such as moorland, shrubland, or woodland) can be at more risk of damage or destruction from wildfire.
Forthcoming good practice guidance on Wildfire resilience in the rural and built environment planning in England, led by the Forestry Commission, breaks the RUI down into four categories or sub-types, shown in table one below.
| Sub-type | Description |
| Classic interface | Is where urban sprawl pressed up against public and private natural areas (i.e. forestry, agricultural, conservation land uses and green belt), with a distinctive line between urban and rural areas. |
| Intermix | Is an area undergoing a transition from agricultural and forest uses to urban land uses. As its name implies, this type of interface involves a mixing of rural and urban land uses in the same area. |
| Isolated interface | Is a remote area interspersed with structures such as summer and recreation homes, ranches, and farms, all surrounded by large areas of vegetation such as in forests and woodlands as well as arable farmsteads and hamlets. |
| Interface islands | Are within predominantly urban areas. These are islands of undeveloped land, post-industrial landscapes, sometimes along river corridors, that are left as cities grow together and create greenspaces. |
Table one: The four sub-types of RUI. Adapted from work by, and used with permission from, Rob Gazzard at the Forestry Commission.
Identifying which of your homes are in the RUI can be challenging. You can use desktop tools, such as Geographic Information Systems (GIS) mapping or publicly available tools like Google Maps to do this. You can also use Defra’s Rural Urban Classification, which classifies small areas according to their level of urbanity or rurality. It is imperfect, but you can use the lookup tables to identify small areas (Lower Super Output Areas, or LSOAs) where you have homes that are at the RUI.
You can also use the knowledge of colleagues, especially those who work in communities or who are involved in planning, asset management, and grounds maintenance.
Finally, be aware that delineating between these different sub-types is often challenging in practice, and scientific work on their definitions continue to evolve and are nuanced. Especially when working with local partners at a local level, you could consider these categories flexibly, as subject to change, and informed by qualitative knowledge as much as quantitative data or mapping. The rural-urban continuum is complex, heterogeneous, and place-specific, and working with local partners to understand this in areas that you operate is important.
Land use patterns
There are also some ways you can identify land use patterns that might make some areas where you have homes more susceptible to wildfire (see table two below). Ideally, you should work with partner organisations such as local fire and rescue services, landowners, local authorities, and nature organisations (see Working in partnership with local actors to reduce wildfire risk) to do this. They will often have a more nuanced, more dynamic, and more up-to-date view of local conditions in areas where you have homes that might indicate a greater or lesser risk of wildfire. They may also have access to specific tools, e.g. GIS mapping with unique land use data, that they could share with you to support your understanding of risk.
| Land-use type | High-risk | Low-risk |
| Forests and woodlands | Young coniferous woodland of pine, spruce or fir; Plantations of eucalyptus/cypress. | Broadleaves, mixed and yew woodlands. |
| Heathland, moorland, and semi-natural grassland | Dwarf shrub heath, gorse, bracken, grasses. | Bogs (unless in drought conditions). |
| Agriculture and horticulture | Arable crops nearing and immediately after harvest. Grasslands nearing harvest. | Grasslands after harvest. |
| Agroforestry | Christmas tree plantations. | Short rotation coppice (excluding eucalyptus). |
| Urban greenspace | Roadside and railway side vegetation (dependent upon season and species). | Gardens in built-up areas. |
Table two: Susceptibility of different land-use types to wildfire, disaggregated by high-risk habitats and low-risk habitats. Reproduced from the Forestry Commission (2014) Building wildfire resilience into forest management planning, p.6.
For example, the amount, type, and distribution of different kinds of vegetation, timber/trees, peat, and other kinds of flora can act as both a catalyst and suppressor of wildfire risk. Good land management, which can include forms of habitat and nature restoration, can reduce the risk of wildfire and reduce the risk of it spreading quickly if it occurs.
Housing providers are not best placed to understand and map this mosaic of land use patterns, but working with local partners can support you to understand and account for it in your risk assessment.
Tools to understand the risk to homes
Any home can be at risk from wildfire, regardless of size, construction materials, or age. However, you can consider undertaking a review of the data you hold on your asset management systems to understand whether you hold any data that might inform a risk assessment.
This review should not just be focused on the home itself, but should move beyond the single curtilage to consider adjacent homes and buildings, including their structure and features, and the wider Home Ignition Zone, defined by the NFCC as an area of approximately 10 metres immediately around the home, and which can extend to approximately 60 metres (see box four).
Another way of understanding the different zones around homes is through the Forestry Commission’s guidance on Wildfire Management Zones (WMZs) (see figure one below).
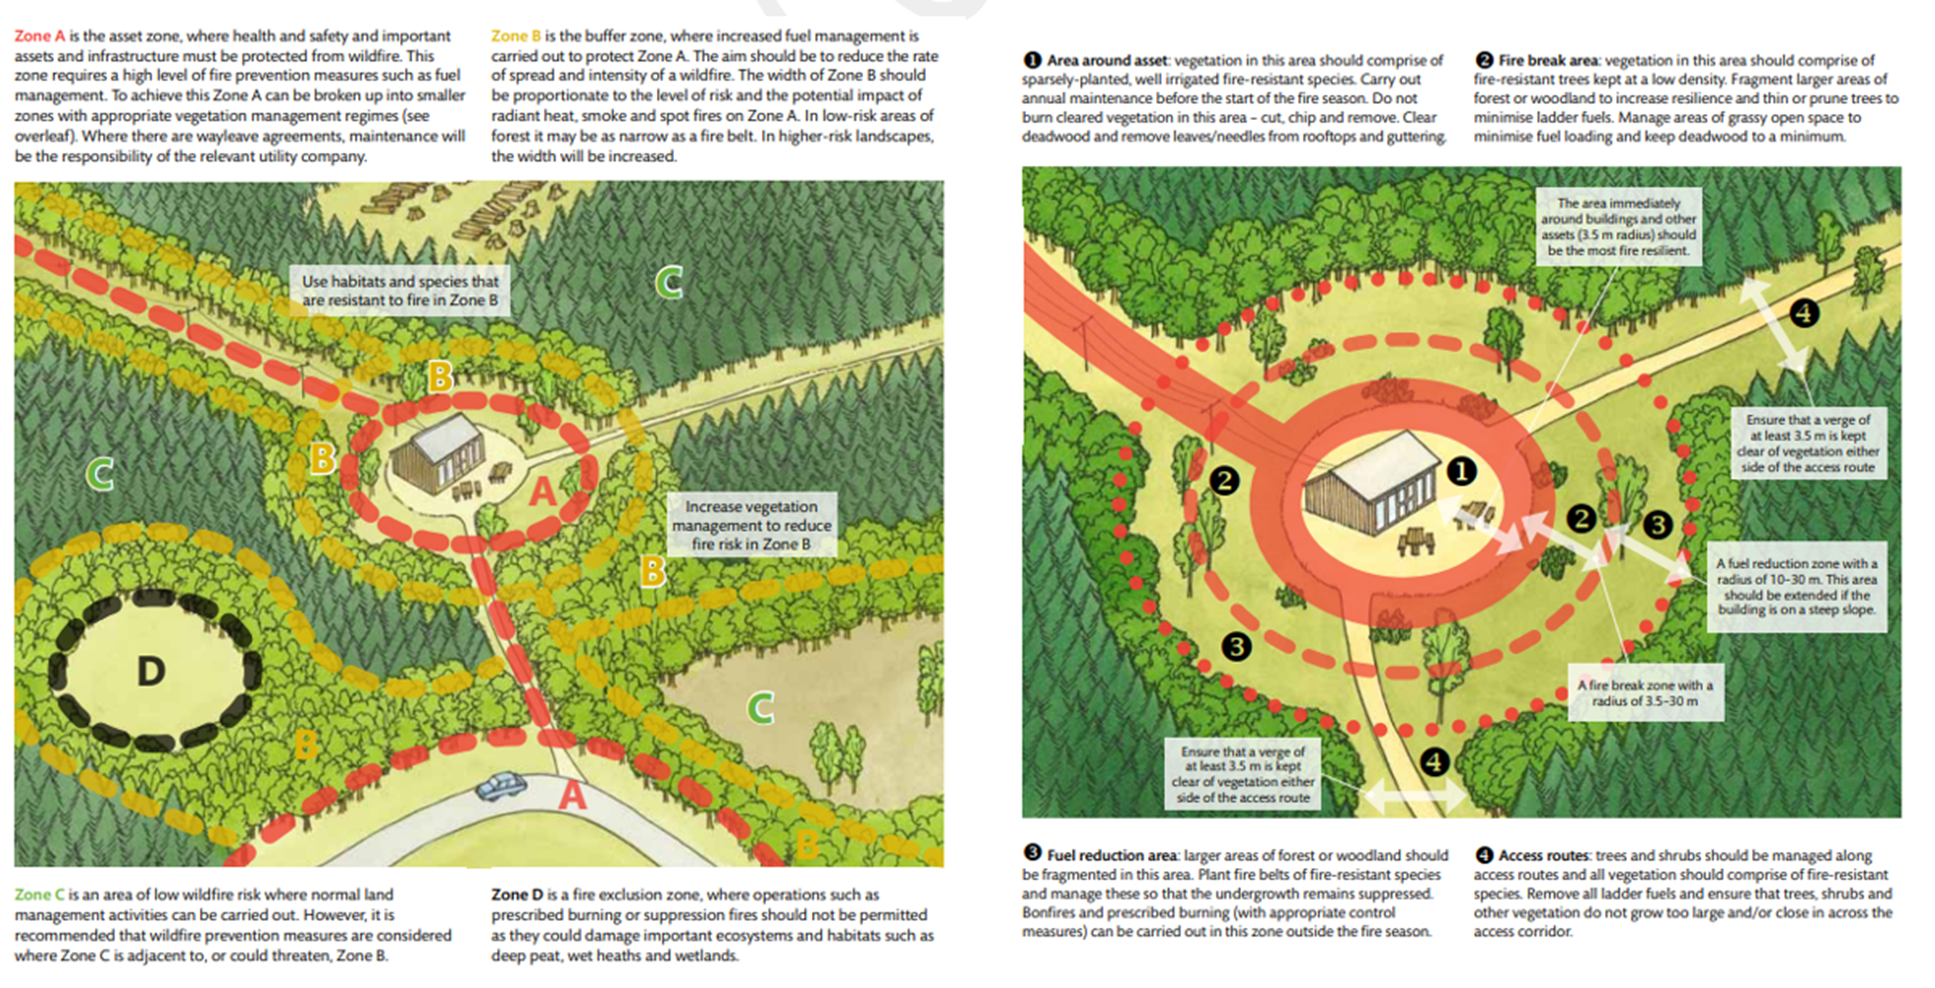
Figure one: The Forestry Commission’s example of WMZs, which can provide a useful framework to help asset managers identify, understand, and prioritise wildfire prevention measures. The left figure is Zones A-D. The right figure is approaches to management in different parts of Zone A. Reproduced from Forestry Commission (2014) Building wildfire resilience into forest management planning, pp-39-40.
According to good practice on Wildfire resilience in the rural and built environment planning in England, led by the Forestry Commission, some of the things you can look out for are specified in table two below.
| Landscape |
|
| Structure/feature |
|
Table two: Structure and feature ignition pathways in and around homes. Adapted from work by, and used with permission from, Rob Gazzard at the Forestry Commission.
In addition, you should consider paying particular attention to any duties you have under the Building Safety Act (2022), which places several responsibilities on building owners to ensure their homes are safe, to other relevant building and fire safety legislation, such as the Regulatory Reform (Fire Safety) Order 2005, and to the more general best practice set out in the British Standards Institution’s standard on fire risk assessment in housing (BS 9792:2025).
According to the NFCC, there are three main zones to consider.
Zone 1: Approximately 0-2 metres around the perimeter of the home. The purpose of this zone is to reduce the chance of embers being blown by the wind and landing near the home, igniting nearby materials or debris. It is closest to the house, so requires a careful selection of flora and other materials.
Zone 2: 2-10 metres around the perimeter of the home. The purpose of this zone is to be a landscape that, if ignited, slows or stops the path of the wildfire towards the home itself. The NFCC recommends that any trees or vegetation in Zone 2 should be well-spaced and well maintained. It should also avoid flora that could act as fuel or vectors for ladder or aerial fires, like shorter vegetation or shrubs under taller trees.
Zone 3: 10-30 metres around the home. The purpose of this zone is to decelerate the spread of the wildfire, through careful management of vegetation and spacing. It will likely need to be undertaken collaboratively between the housing provider and relevant local landowners.
In addition, sloping/gradient is also relevant for the Home Ignition Zone. Wildfires burn up a slope faster and more intensely. Homes located on or atop a slope can be more vulnerable for this reason, and their zones may need to be expanded.
Understanding the data you hold about your homes is useful for the purposes of wildfire risk assessment, but also for informing a gap analysis. This gap analysis can inform the kinds of information you collect in the future about your homes during planned or responsive maintenance work, or stock condition surveys, which can in turn inform how you support residents (see Supporting residents with wildfires) and strategic assessment management and grounds maintenance work (see Strategic asset management and wildfires).
However, do not forget that any home can be at risk of wildfire. A data-driven approach using geographical and asset management data can help you prioritise, but homes that are not considered to have high risk do not have no risk at all.
Tools to understand the risk to residents
Finally, the risk is not the same for all residents. Under the Regulator of Housing’s Consumer Standards, social housing providers are expected to understand the diverse needs of their residents. They must understand the diverse needs of residents arising from protected characteristics under the Transparency, Influence, and Accountability Standard, and ensure this understanding is used to deliver safe homes and equitable services.
In addition, Awaab’s Law requires social housing providers to take a person-centred approach to harm, which considers any pre-existing vulnerabilities or health conditions when assessing hazards.
This is relevant for assessing wildfire risk. Specifically, you can consider using any data you hold about the diverse needs, vulnerabilities, and circumstances of your residents to inform a person-centred assessment of wildfire risk. You could focus on:
- The specific needs of any residents that may not be able to escape wildfire spread without support. This includes, but is not limited to, needs related to physical (e.g. mobility), cognitive (e.g. memory, understanding), psychological (e.g. anxiety, autism), medical (e.g. chronic fatigue), and social (e.g. language barriers) forms of vulnerability. Any assessment of these needs should also be aware that some are lifelong, while others are temporary or situational; and that some are not visible (e.g. when related to mental health or neurodivergence).
- The specific needs of any residents that may be particularly vulnerable to the inhalation of smoke. Smoke can be particularly harmful for residents with pre-existing illnesses, especially respiratory conditions, very young children and babies, older adults, and pregnant women.
As discussed in Working in partnership with local actors to reduce wildfire risk, you can also explore any opportunities for collaborating and sharing data with local partners, especially fire and rescue services, to support any work they do in evacuating homes and responding to wildfire risk.
Taking a dynamic, matrix approach to wildfire risk
For housing providers, wildfire risk exists at the intersection of geographical characteristics, property characteristics, and resident vulnerabilities. In turn, this risk is exacerbated by certain weather conditions, especially the presence of hot, dry weather, and/or high winds.
You can work towards a holistic assessment and understanding of wildfire risk based on this intersection. One way of doing this could be to take a matrix or scoring approach, which could assign risk scores to individual homes, specific postcodes, or specific developments based the presence of one or more of the data points or issues discussed in this chapter. Different risk scores could trigger different actions, or ascribe more urgent prioritisation to the same actions depending on their score.
An alternative, easier to way is to create a wildfire risk flag that is attached to homes in your asset management system, triggering certain asset management and maintenance actions. This could be based on a simple categorisation of high, medium, and low wildfire risk based on geography (e.g. postcode) (see Strategic asset management and wildfires). Doing this can also help you to understand which of your homes and communities might be particularly at risk during hot, dry weather, and therefore inform your approach to monitoring weather.
However, it is also good practice to recognise that your assessment of wildfire risk should be dynamic. Wildfire risk changes daily. New residents move into homes. Planned maintenance or retrofit works take place that change the materials that make up the building. Landowners implement new strategies, planting trees or managing flora.
This means that your initial assessment of wildfire risk should be just that – an initial assessment, which can also act as a gap analysis to tell you what you don’t know, but might want to know. You can then develop strategies, plans, and policies for keeping information updated and collecting new information that you do not have, such as through including specific wildfire-related items in stock condition surveys and regularly monitoring weather. This can then inform a dynamic, strategic, and ongoing approach to risk and asset management, which is the subject of Strategic asset management and wildfires.